Logo
Logo
ServicesIndustriesCase StudiesBlogsCareersLet's Connect
blue-white-icon
black-image
Logo
ServicesIndustriesCase StudiesBlogsCareersLet's Connect
burger-icon
hamburger
The Hidden Costs of Full-Time Hiring vs. Staff Augmentation: A 2026 Cost Breakdown
Blogs/The Hidden Costs of Full-Time Hiring vs. Staff Augmentation: A 2026 Cost Breakdown

The Hidden Costs of Full-Time Hiring vs. Staff Augmentation: A 2026 Cost Breakdown

December 17, 2025
Share Now

Table of Contents

  1. 1. The Hidden Costs of Full-Time Hiring vs. Staff Augmentation: A 2026 Cost Breakdown
  2. 2. Why "Salary vs. Hourly Rate" Is the Wrong Comparison
  3. 3. What Staff Augmentation Actually Costs
  4. 4. Decision Framework: Which Model Fits Your Situation?
  5. 5. The Hybrid Model: Using Both Strategically
  6. 6. Frequently Asked Questions
  7. 7. How 4Labs Technologies Helps You Decide

Most hiring decisions start with the wrong math. A company compares a $150,000 salary to a $200-an-hour contractor rate, decides the salary looks cheaper, and moves on. That comparison misses almost everything that actually costs money.
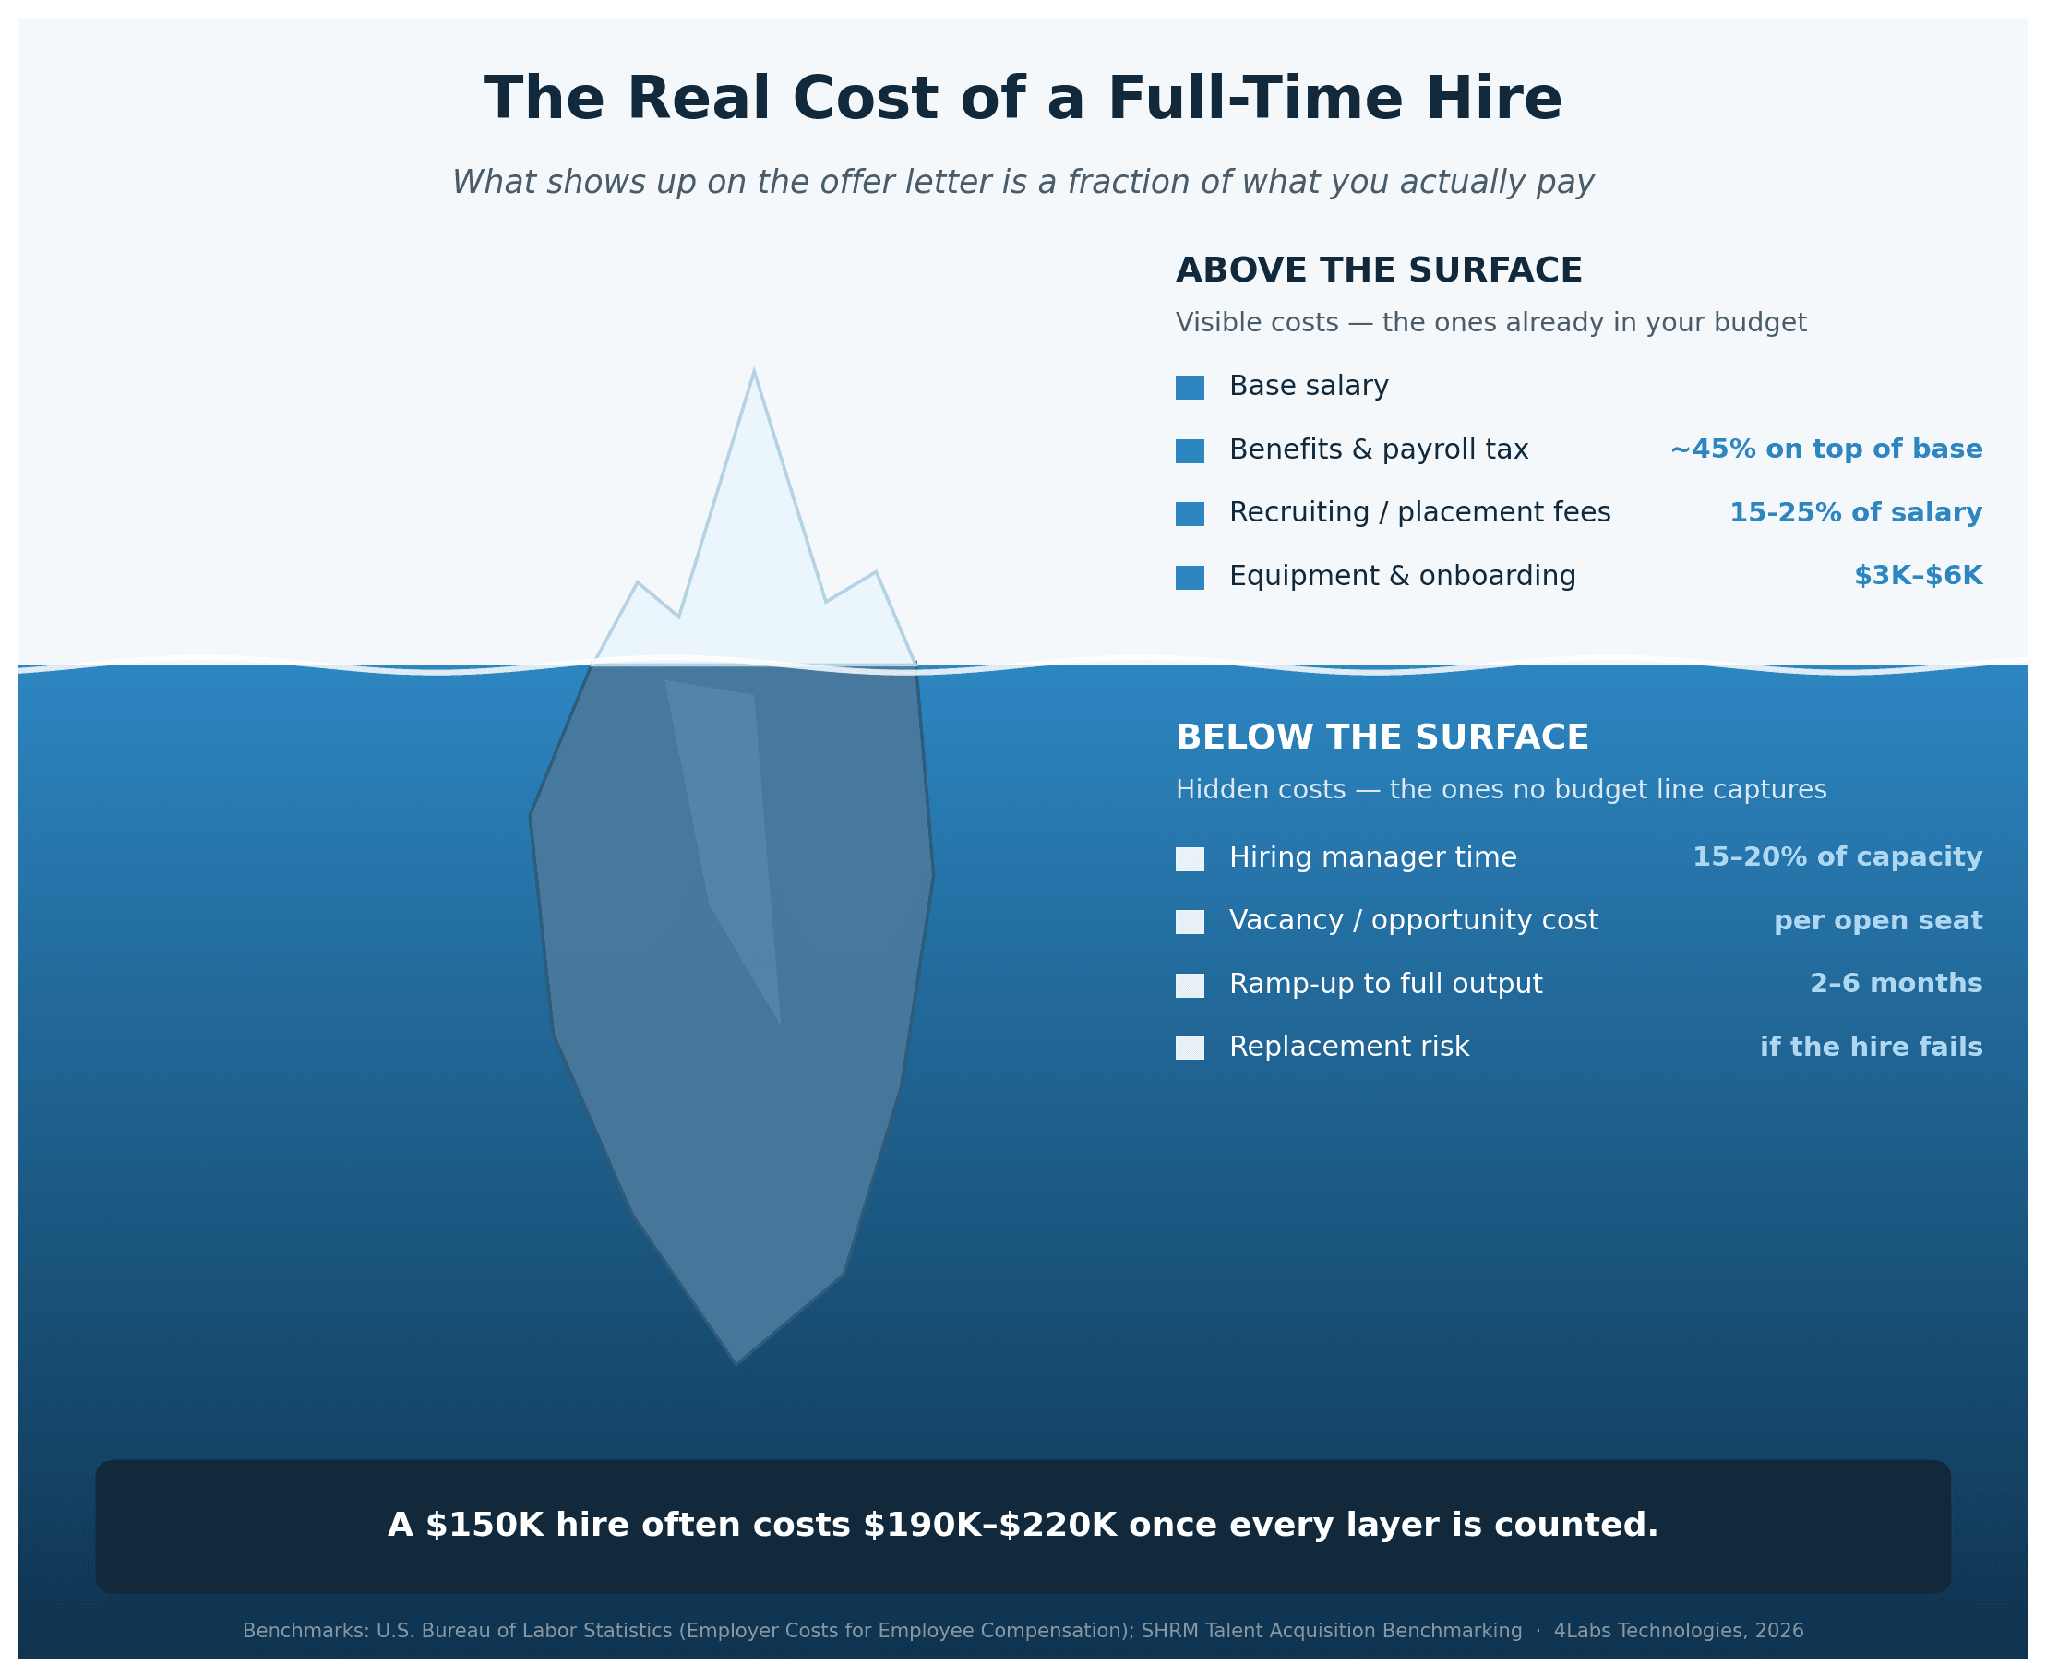
A $150,000 hire in the U.S. often runs $190,000 to $220,000 in year one once you add benefits, payroll taxes, recruiting, onboarding, and the months it takes a new employee to reach full output. None of that shows up on the offer letter. All of it shows up in your budget.
That's the real question behind staff augmentation vs. full-time hiring. It isn't which option costs less per hour. It's which option costs less once every hidden cost is on the table.
This guide breaks down what full-time hiring really costs, what staff augmentation actually costs, and how to tell which model fits the role you're trying to fill. The figures below reflect 2026 U.S. compensation data and current staff augmentation market rates.

Stay Ahead of Cyber Threats

Get expert insights, security briefings, and the latest innovations in your inbox.

  • Afghanistan+93
  • Albania+355
  • Algeria+213
  • Andorra+376
  • Angola+244
  • Antigua and Barbuda+1268
  • Argentina+54
  • Armenia+374
  • Aruba+297
  • Australia+61
  • Austria+43
  • Azerbaijan+994
  • Bahamas+1242
  • Bahrain+973
  • Bangladesh+880
  • Barbados+1246
  • Belarus+375
  • Belgium+32
  • Belize+501
  • Benin+229
  • Bhutan+975
  • Bolivia+591
  • Bosnia and Herzegovina+387
  • Botswana+267
  • Brazil+55
  • British Indian Ocean Territory+246
  • Brunei+673
  • Bulgaria+359
  • Burkina Faso+226
  • Burundi+257
  • Cambodia+855
  • Cameroon+237
  • Canada+1
  • Cape Verde+238
  • Caribbean Netherlands+599
  • Cayman Islands+1
  • Central African Republic+236
  • Chad+235
  • Chile+56
  • China+86
  • Colombia+57
  • Comoros+269
  • Congo+243
  • Congo+242
  • Costa Rica+506
  • Côte d'Ivoire+225
  • Croatia+385
  • Cuba+53
  • Curaçao+599
  • Cyprus+357
  • Czech Republic+420
  • Denmark+45
  • Djibouti+253
  • Dominica+1767
  • Dominican Republic+1
  • Ecuador+593
  • Egypt+20
  • El Salvador+503
  • Equatorial Guinea+240
  • Eritrea+291
  • Estonia+372
  • Ethiopia+251
  • Faroe Islands+298
  • Fiji+679
  • Finland+358
  • France+33
  • French Guiana+594
  • French Polynesia+689
  • Gabon+241
  • Gambia+220
  • Georgia+995
  • Germany+49
  • Ghana+233
  • Gibraltar+350
  • Greece+30
  • Greenland+299
  • Grenada+1473
  • Guadeloupe+590
  • Guam+1671
  • Guatemala+502
  • Guinea+224
  • Guinea-Bissau+245
  • Guyana+592
  • Haiti+509
  • Honduras+504
  • Hong Kong+852
  • Hungary+36
  • Iceland+354
  • India+91
  • Indonesia+62
  • Iran+98
  • Iraq+964
  • Ireland+353
  • Israel+972
  • Italy+39
  • Jamaica+1876
  • Japan+81
  • Jordan+962
  • Kazakhstan+7
  • Kenya+254
  • Kiribati+686
  • Kosovo+383
  • Kuwait+965
  • Kyrgyzstan+996
  • Laos+856
  • Latvia+371
  • Lebanon+961
  • Lesotho+266
  • Liberia+231
  • Libya+218
  • Liechtenstein+423
  • Lithuania+370
  • Luxembourg+352
  • Macau+853
  • Macedonia+389
  • Madagascar+261
  • Malawi+265
  • Malaysia+60
  • Maldives+960
  • Mali+223
  • Malta+356
  • Marshall Islands+692
  • Martinique+596
  • Mauritania+222
  • Mauritius+230
  • Mayotte+262
  • Mexico+52
  • Micronesia+691
  • Moldova+373
  • Monaco+377
  • Mongolia+976
  • Montenegro+382
  • Morocco+212
  • Mozambique+258
  • Myanmar+95
  • Namibia+264
  • Nauru+674
  • Nepal+977
  • Netherlands+31
  • New Caledonia+687
  • New Zealand+64
  • Nicaragua+505
  • Niger+227
  • Nigeria+234
  • North Korea+850
  • Norway+47
  • Oman+968
  • Pakistan+92
  • Palau+680
  • Palestine+970
  • Panama+507
  • Papua New Guinea+675
  • Paraguay+595
  • Peru+51
  • Philippines+63
  • Poland+48
  • Portugal+351
  • Puerto Rico+1
  • Qatar+974
  • Réunion+262
  • Romania+40
  • Russia+7
  • Rwanda+250
  • Saint Kitts and Nevis+1869
  • Saint Lucia+1758
  • Saint Pierre & Miquelon+508
  • Saint Vincent and the Grenadines+1784
  • Samoa+685
  • San Marino+378
  • São Tomé and Príncipe+239
  • Saudi Arabia+966
  • Senegal+221
  • Serbia+381
  • Seychelles+248
  • Sierra Leone+232
  • Singapore+65
  • Slovakia+421
  • Slovenia+386
  • Solomon Islands+677
  • Somalia+252
  • South Africa+27
  • South Korea+82
  • South Sudan+211
  • Spain+34
  • Sri Lanka+94
  • Sudan+249
  • Suriname+597
  • Swaziland+268
  • Sweden+46
  • Switzerland+41
  • Syria+963
  • Taiwan+886
  • Tajikistan+992
  • Tanzania+255
  • Thailand+66
  • Timor-Leste+670
  • Togo+228
  • Tonga+676
  • Trinidad and Tobago+1868
  • Tunisia+216
  • Turkey+90
  • Turkmenistan+993
  • Tuvalu+688
  • Uganda+256
  • Ukraine+380
  • United Arab Emirates+971
  • United Kingdom+44
  • United States+1
  • Uruguay+598
  • Uzbekistan+998
  • Vanuatu+678
  • Vatican City+39
  • Venezuela+58
  • Vietnam+84
  • Wallis & Futuna+681
  • Yemen+967
  • Zambia+260
  • Zimbabwe+263
Our Services
Digital Marketing
Staff Augmentation
IT Infrastructure
ERP Solutions
Software Development
Web & App Development
Industries
Cryptocurrency and Blockchain
Banking, Financial Services, and Insurance (BFSI)
Lending and FinTech
Oil and Gas
Energy and Utilities
Automotive and Manufacturing
Agriculture
Real Estate
E-commerce and Retail
Case Studies
Financial Services Test Automation
AI-Driven Customer Risk Profiling
Elevating Mobile Performance
Jewelry Client Transformation
AI Underwriting Revolution
Advanced Cybersecurity Solutions
Eyewear Retailer Transformation
Revolutionizing Manufacturing Operations
Offshore Development Excellence
Company

About Us

Careers

Let's Connect

Business Referral

Engagement Model

Partnership Programs

Resources

Blogs

footer1-iconfooter2-iconiso_iconiso_icon2

4labsicon

Copyright © 2026 4Labs Technologies. All Rights Reserved.

Privacy Policy

Terms & Conditions

Accessibility

fb-icon
twitter-icon
instagram-icon
linkedin-icon

Why "Salary vs. Hourly Rate" Is the Wrong Comparison

Compare a full-time salary to a contractor's hourly rate, and full-time hiring almost always looks cheaper. A $150,000 salary works out to about $72 an hour. A staff augmentation engineer billing $85 an hour looks expensive next to that.
The comparison only counts one side of the ledger. The $150,000 salary is a visible cost: the number on the offer letter, the one everyone budgets around. It leaves out the other visible costs a salary doesn't include, like benefits and recruiting. It also leaves out the hidden costs that never show up in a spreadsheet at all. Think of the hiring manager's time, the empty seat while you search, and the months a new hire spends ramping up.
Staff augmentation pricing works differently. The rate you're quoted is close to the full cost. There is little hiding underneath it.
A fair comparison needs three categories: the visible costs of full-time hiring, the hidden costs of full-time hiring, and what staff augmentation actually costs. That's what the rest of this guide covers, with the sales pitch on both sides stripped away.

The Visible Costs of Full-Time Hiring

These are the costs already sitting in your budget. None of them are hidden. Most companies still underestimate how much they add up to.

Base Salary

Base salary is the cost everyone sees, and the one most budgets get built around. It's also the smallest piece of the total. On its own, it typically covers 60% to 70% of what a full-time employee actually costs in year one.

Benefits (Health, PTO, 401(k))

Benefits are where most cost estimates go wrong. The U.S. Bureau of Labor Statistics reported that benefits accounted for 31.5% of total compensation for full-time private-industry workers in mid-2026. Run that split against base salary instead of total compensation, and benefits add roughly 40% to 45% on top of salary. That's well above the 20% to 25% figure that circulates in most hiring guides. Health insurance, paid leave, retirement contributions, and payroll taxes like Social Security and Medicare all sit inside that number.

Recruitment Fees

If you use an external recruiter, contingency fees typically run 15% to 25% of the new hire's first-year salary. On a $150,000 role, that's $22,500 to $37,500, paid regardless of whether the hire stays six months or six years. Internal recruiting avoids the fee but shifts the cost into hiring manager and recruiter time instead.

Equipment & Onboarding Overhead

A laptop, software licenses, a desk, and the first week of paperwork and training usually cost $3,000 to $6,000 per new hire, before that person has done any billable work.

The Hidden (Invisible) Costs Nobody Budgets For

The costs above are visible: a line item someone in finance already tracks. The costs below are invisible. They rarely appear in a job requisition or a budget line, but they're just as real, and they're usually where a full-time hire quietly gets expensive.

Hiring Manager Time

A hiring manager typically spends 15% to 20% of their working hours on a search that runs several weeks: writing the job description, screening resumes, running interviews, and negotiating an offer. That's time not spent managing the team or the work the search was meant to support.

Vacancy Cost: The Opportunity Cost of an Unfilled Seat

Every week a seat stays open is a week the work it covers doesn't get done. A revenue-generating or delivery-critical role left unfilled for two months can cost more in lost output than the eventual hire's entire first-year salary. That's especially true if the delay pushes back a launch or a client deliverable.

Ramp-Up: Time-to-Productivity

New hires rarely perform at full capacity on day one. Most roles take two to six months to reach full productivity, depending on seniority and complexity. During that window, you're paying full salary for partial output, and the more specialized the role, the longer that window tends to run.

Replacement Risk If the Hire Doesn't Work Out

A widely cited U.S. Department of Labor estimate puts the cost of a bad hire at up to 30% of that employee's first-year salary. That figure counts severance, the redo of the search, and lost time. On a $150,000 role, that's a $45,000 mistake, and it resets your hiring timeline back to week one.
Real cost of a full-time hire.png

What Staff Augmentation Actually Costs

Staff augmentation flips the cost structure. Instead of a base salary plus a long list of add-ons, you pay one rate that already includes most of what a full-time hire adds on top of salary.

What You Pay For

You pay an hourly or monthly rate that covers the professional's compensation, the provider's overhead, and their margin. For a senior software engineer, that typically runs $60 to $95 an hour depending on region, specialization, and whether the talent is onshore, nearshore, or offshore.

What You Don't Pay For

No benefits. No employer payroll taxes. No recruiting fee in most arrangements. No equipment budget. No severance if the engagement ends. You also avoid most of the vacancy cost of a long search, since a vetted staff augmentation professional can typically start within one to three weeks.
Here's how the two models compare across a typical 9- to 12-month engagement:

Cost Category Full-Time Hire Staff Augmentation
Base compensation Yes Yes — built into the rate
Benefits & payroll tax Yes, ~45% on top of salary No — provider's responsibility
Recruiting / placement fee Often, 15–25% of salary No, or a smaller one-time fee
Equipment & onboarding Yes, $3K–$6K Minimal to none
Severance / offboarding cost Possible No
Management overhead Yes Yes, similar level
Typical time to start 5–8 weeks 1–3 weeks

Real Numbers: A Direct Cost Comparison

The categories above are the same for every role. The dollar amounts depend on seniority. Here's how the numbers play out for two common technical roles, using the benchmarks from this guide:

  Mid-Level Software Engineer Senior Software Engineer
Base salary $110,000 $165,000
Benefits & payroll tax (~45%) $49,500 $74,250
Recruiting fee (~18% of salary) $20,000 $30,000
Equipment & onboarding $4,000 $5,000
Fully-loaded Year 1 cost (FTE) ~$184,000 ~$274,000
Staff augmentation equivalent (Year 1)* ~$146,000 ~$187,000
Approx. Year 1 savings ~$38,000 (21%) ~$87,000 (32%)

Staff augmentation figures assume a blended rate of $70/hr (mid-level) and $90/hr (senior) at full-time hours. Full-time figures assume the BLS benefits benchmark (~45% of base) and a mid-range recruiting fee. Your own numbers will vary by role, location, and whether you recruit internally or through an agency — the categories won't change even if the dollar amounts do.
The gap narrows for junior roles and widens for senior and highly specialized ones, where recruiting fees and benefits load are highest relative to base salary.

The Speed Factor: Time-to-Value

Cost is only half the comparison. The other half is how fast each model gets you real output.

Stage Full-Time Hiring Staff Augmentation
Time to fill the role 5–8 weeks 1–3 weeks
Time to full productivity 2–6 months 2–4 weeks
Time to total value 3–8 months 3–7 weeks

A five-to-eight-week search followed by a two-to-six-month ramp means a full-time hire can take the better part of a year to reach full value. Staff augmentation compresses that timeline to weeks, which matters most when a project has a fixed deadline or a market window that won't wait.

Decision Framework: Which Model Fits Your Situation?

Cost and speed both point the same direction most of the time, but the right call still depends on the role. Use the framework below before defaulting to your usual hiring process.

Criterion Favors Full-Time Hiring Favors Staff Augmentation
Expected duration of need 2+ years, ongoing Defined project or under 12 months
Skill specialization Broad, evolves with the company Narrow, tied to a stack or project
Speed required You can wait 5–8 weeks You need someone in 1–3 weeks
Budget predictability Fixed headcount budget preferred Variable, scales with workload
IP / strategic sensitivity High — core product, trade secrets Lower — well-scoped, contained work
Leadership pipeline Building long-term leadership Not a leadership-track need

If most of your answers land in one column, that's a strong signal. If they split, the role is probably a candidate for the hybrid approach covered below.

When Full-Time Hiring Still Wins

Staff augmentation wins on cost and speed often enough that it's tempting to default to it for everything. It shouldn't be the default for every role.
Full-time hiring is usually the better choice for core product engineering that only your team fully understands, for work that touches sensitive intellectual property or regulated data, and for roles you're grooming into future team leads or managers. These roles benefit from institutional knowledge and long-term commitment that a rotating cast of contractors can't build as easily.
The cost math in this guide still applies to these roles. It just gets outweighed by what you gain from continuity, deep context, and a leadership pipeline that a purely project-based model doesn't build.

The Hybrid Model: Using Both Strategically

Most companies don't need to choose one model for their entire team. A common pattern works like this: a small core of full-time employees owns the product, the architecture, and the client relationships. Staff augmentation talent then scales up around them for specific projects, deadlines, or skill gaps.
This hybrid approach keeps fixed headcount costs predictable while giving you room to flex when a project demands more hands, or a different specialty, than your core team has.

Key Takeaways

  • A fully loaded full-time hire often costs 40% to 65% more than the base salary alone, once benefits, payroll taxes, recruiting, and onboarding are counted.
  • Bureau of Labor Statistics data puts benefits at 31.5% of total compensation for full-time private-industry workers in 2026, which works out to roughly 40% to 45% on top of base salary.
  • Staff augmentation typically costs 20% to 35% less than a fully loaded full-time hire in year one for mid-level and senior technical roles.
  • A vetted staff augmentation professional can start within one to three weeks, compared to five to eight weeks for a typical full-time hire in the U.S.
  • A bad full-time hire can cost up to 30% of that employee's first-year salary once severance, rehiring, and lost time are added in.

Frequently Asked Questions

What is the real cost difference between full-time hiring and staff augmentation?

A full-time hire typically costs 40% to 65% more than base salary alone once benefits, payroll taxes, recruiting, and onboarding are included. Staff augmentation pricing is close to all-in, so the quoted rate is close to the total cost. Across the mid-level and senior roles in this guide, staff augmentation ran 20% to 35% less than the fully loaded cost of an equivalent full-time hire in year one.

How long does it take to hire vs. staff-augment a role?

Filling a full-time role in the U.S. typically takes five to eight weeks from job posting to signed offer, followed by two to six months before the new hire reaches full productivity. A vetted staff augmentation professional can typically start within one to three weeks and reach full output within a few weeks after that.

Is staff augmentation cheaper for long-term roles?

For roles longer than two years, the math shifts. Full-time hiring spreads its fixed costs, like recruiting fees and onboarding, over a longer period, which narrows the cost gap. For core roles you expect to keep indefinitely, full-time hiring is often the better long-term value; for roles with a defined end date or uncertain duration, staff augmentation usually wins.

What hidden costs does full-time hiring include?

The hidden costs include hiring manager time spent on the search, the opportunity cost of an unfilled seat, and the two to six months it takes a new hire to reach full productivity. There's also the risk of repeating the entire process if the hire doesn't work out. None of these appear in a standard budget line, but all of them affect what a hire actually costs.

Can staff augmentation convert to full-time hiring?

Yes. Many staff augmentation arrangements include a conversion option, sometimes called contract-to-hire, that lets you bring the professional on as a full-time employee after a defined period. This lets you evaluate fit on a live project before making a permanent commitment, usually for a conversion fee that's still lower than a full external search.

Why do benefits cost more than most hiring guides say?

Most hiring guides cite a 20% to 25% benefits load, but that figure usually leaves out legally required costs like Social Security and Medicare taxes. Bureau of Labor Statistics data tells a different story: calculated correctly against base wages rather than total compensation, the real number for full-time private-industry workers is closer to 40% to 45% on top of salary.

Does staff augmentation work for non-technical roles?

Yes, though it's most common in technology, where the model originated. Staff augmentation is increasingly used for finance, marketing, design, and operations roles that need specialized skills for a defined period without a permanent headcount commitment.

How do I decide between hiring and staff augmentation for my next role?

Start with three questions: how long do you need this skill set, how specialized is the work, and how fast do you need someone in the seat? Roles that are long-term, core to your product, and not time-sensitive usually favor full-time hiring. Roles that are project-based, specialized, or urgent usually favor staff augmentation.

How 4Labs Technologies Helps You Decide

Every hiring decision is really a bet on how long you'll need a skill and how fast you need it in place. 4Labs Technologies works with SMBs, startups, and enterprise teams to run that calculation for a specific role, not a generic one, and to build the mix of full-time and augmented talent that fits the budget and timeline you're actually working with.
If you're weighing a hire against a staff augmentation engagement right now, talk to our team.
We'll walk through the real numbers for your situation before you commit to either one.

‹ PreviousNext ›