Logo
Logo
ServicesIndustriesCase StudiesBlogsCareersLet's Connect
blue-white-icon
black-image
Logo
ServicesIndustriesCase StudiesBlogsCareersLet's Connect
burger-icon
hamburger
blog-image
Blogs/Performance Testing in Development

Performance Testing in Application Development: Which Test Answers Your Question

January 20, 2025
Share Now

Table of Contents

  1. 1. What performance testing measures, and what it cannot tell you
  2. 2. Types of performance testing, by the question each one answers
  3. 3. The performance test environment decides whether the result is worth anything
  4. 4. Where a performance target comes from
  5. 5. The performance testing process, end to end
  6. 6. Reading a failure: from a slow number to a named cause
  7. 7. Performance testing best practices: when to run which test
  8. 8. Performance testing: quick answers
  9. 9. Where to take your performance testing next

Every guide on this subject gives you the same five names: load, stress, spike, soak, scalability. Each gets a sentence, none gets a purpose, and you finish the page knowing the vocabulary and still not knowing which one to run on Monday.

They are not five flavours of the same test. They are five different questions, and the shape of the load is what separates them. Running the wrong one gives you a clean report and no information, which is worse than not testing, because now somebody believes something.

So this page is organised around the questions rather than the taxonomy. What performance testing measures and what it cannot tell you. Which test answers which worry. Why the environment decides whether any of it means anything. Where a target legitimately comes from. And how to read a failure, which is where the real work sits.

Stay Ahead With 4Labs

Get expert insights, security briefings, and the latest innovations in your inbox.

  • Afghanistan+93
  • Albania+355
  • Algeria+213
  • Andorra+376
  • Angola+244
  • Antigua and Barbuda+1268
  • Argentina+54
  • Armenia+374
  • Aruba+297
  • Australia+61
  • Austria+43
  • Azerbaijan+994
  • Bahamas+1242
  • Bahrain+973
  • Bangladesh+880
  • Barbados+1246
  • Belarus+375
  • Belgium+32
  • Belize+501
  • Benin+229
  • Bhutan+975
  • Bolivia+591
  • Bosnia and Herzegovina+387
  • Botswana+267
  • Brazil+55
  • British Indian Ocean Territory+246
  • Brunei+673
  • Bulgaria+359
  • Burkina Faso+226
  • Burundi+257
  • Cambodia+855
  • Cameroon+237
  • Canada+1
  • Cape Verde+238
  • Caribbean Netherlands+599
  • Cayman Islands+1
  • Central African Republic+236
  • Chad+235
  • Chile+56
  • China+86
  • Colombia+57
  • Comoros+269
  • Congo+243
  • Congo+242
  • Costa Rica+506
  • Côte d'Ivoire+225
  • Croatia+385
  • Cuba+53
  • Curaçao+599
  • Cyprus+357
  • Czech Republic+420
  • Denmark+45
  • Djibouti+253
  • Dominica+1767
  • Dominican Republic+1
  • Ecuador+593
  • Egypt+20
  • El Salvador+503
  • Equatorial Guinea+240
  • Eritrea+291
  • Estonia+372
  • Ethiopia+251
  • Faroe Islands+298
  • Fiji+679
  • Finland+358
  • France+33
  • French Guiana+594
  • French Polynesia+689
  • Gabon+241
  • Gambia+220
  • Georgia+995
  • Germany+49
  • Ghana+233
  • Gibraltar+350
  • Greece+30
  • Greenland+299
  • Grenada+1473
  • Guadeloupe+590
  • Guam+1671
  • Guatemala+502
  • Guinea+224
  • Guinea-Bissau+245
  • Guyana+592
  • Haiti+509
  • Honduras+504
  • Hong Kong+852
  • Hungary+36
  • Iceland+354
  • India+91
  • Indonesia+62
  • Iran+98
  • Iraq+964
  • Ireland+353
  • Israel+972
  • Italy+39
  • Jamaica+1876
  • Japan+81
  • Jordan+962
  • Kazakhstan+7
  • Kenya+254
  • Kiribati+686
  • Kosovo+383
  • Kuwait+965
  • Kyrgyzstan+996
  • Laos+856
  • Latvia+371
  • Lebanon+961
  • Lesotho+266
  • Liberia+231
  • Libya+218
  • Liechtenstein+423
  • Lithuania+370
  • Luxembourg+352
  • Macau+853
  • Macedonia+389
  • Madagascar+261
  • Malawi+265
  • Malaysia+60
  • Maldives+960
  • Mali+223
  • Malta+356
  • Marshall Islands+692
  • Martinique+596
  • Mauritania+222
  • Mauritius+230
  • Mayotte+262
  • Mexico+52
  • Micronesia+691
  • Moldova+373
  • Monaco+377
  • Mongolia+976
  • Montenegro+382
  • Morocco+212
  • Mozambique+258
  • Myanmar+95
  • Namibia+264
  • Nauru+674
  • Nepal+977
  • Netherlands+31
  • New Caledonia+687
  • New Zealand+64
  • Nicaragua+505
  • Niger+227
  • Nigeria+234
  • North Korea+850
  • Norway+47
  • Oman+968
  • Pakistan+92
  • Palau+680
  • Palestine+970
  • Panama+507
  • Papua New Guinea+675
  • Paraguay+595
  • Peru+51
  • Philippines+63
  • Poland+48
  • Portugal+351
  • Puerto Rico+1
  • Qatar+974
  • Réunion+262
  • Romania+40
  • Russia+7
  • Rwanda+250
  • Saint Kitts and Nevis+1869
  • Saint Lucia+1758
  • Saint Pierre & Miquelon+508
  • Saint Vincent and the Grenadines+1784
  • Samoa+685
  • San Marino+378
  • São Tomé and Príncipe+239
  • Saudi Arabia+966
  • Senegal+221
  • Serbia+381
  • Seychelles+248
  • Sierra Leone+232
  • Singapore+65
  • Slovakia+421
  • Slovenia+386
  • Solomon Islands+677
  • Somalia+252
  • South Africa+27
  • South Korea+82
  • South Sudan+211
  • Spain+34
  • Sri Lanka+94
  • Sudan+249
  • Suriname+597
  • Swaziland+268
  • Sweden+46
  • Switzerland+41
  • Syria+963
  • Taiwan+886
  • Tajikistan+992
  • Tanzania+255
  • Thailand+66
  • Timor-Leste+670
  • Togo+228
  • Tonga+676
  • Trinidad and Tobago+1868
  • Tunisia+216
  • Turkey+90
  • Turkmenistan+993
  • Tuvalu+688
  • Uganda+256
  • Ukraine+380
  • United Arab Emirates+971
  • United Kingdom+44
  • United States+1
  • Uruguay+598
  • Uzbekistan+998
  • Vanuatu+678
  • Vatican City+39
  • Venezuela+58
  • Vietnam+84
  • Wallis & Futuna+681
  • Yemen+967
  • Zambia+260
  • Zimbabwe+263
Our Services
Digital Marketing
Staff Augmentation
IT Infrastructure
ERP Solutions
Software Development
Web & App Development
Industries
Cryptocurrency and Blockchain
Banking, Financial Services, and Insurance (BFSI)
Lending and FinTech
Oil and Gas
Energy and Utilities
Automotive and Manufacturing
Agriculture
Real Estate
E-commerce and Retail
Case Studies
Financial Services Test Automation
AI-Driven Customer Risk Profiling
Elevating Mobile Performance
Jewelry Client Transformation
AI Underwriting Revolution
Advanced Cybersecurity Solutions
Eyewear Retailer Transformation
Revolutionizing Manufacturing Operations
Offshore Development Excellence
Company

About Us

Careers

Let's Connect

Business Referral

Engagement Model

Partnership Programs

Resources

Blogs

footer1-iconfooter2-iconiso_iconiso_icon2

4labsicon

Copyright © 2026 4Labs Technologies. All Rights Reserved.

Privacy Policy

Terms & Conditions

Accessibility

fb-icon
twitter-icon
instagram-icon
linkedin-icon

One thing this page will not do is give you a target response time. Every competing page does, and the number is wrong for you, because it was invented for somebody else. There is a whole section on where a defensible target comes from instead. This sits alongside our QA and software testing services work.

What performance testing measures, and what it cannot tell you

Functional testing asks whether the software does the right thing. Performance testing asks whether it still does the right thing when a lot of people ask at once, and how it behaves when it stops.

That second half matters, because every system has a limit. Performance testing is how you find out where yours is, and what happens when you reach it, before a Tuesday afternoon finds out for you.

What it cannot tell you is whether the software is correct. A system can be beautifully fast and return the wrong answer, and a performance test will report a pass. These are different disciplines that happen to share a team, and our page on software quality assurance covers the wider picture they both sit in.

The four numbers every performance test produces

Whatever tool you use, the output reduces to four things.

Response time: how long one operation takes, from request to usable answer. Not from request to first byte, which is a number that flatters.

Throughput: how many operations the system completes per second. This is the capacity number, and it is the one that stops rising when you hit the wall.

Error rate: the proportion of requests that fail. A system under pressure usually starts erroring before it starts slowing, and teams that watch only response time miss the first signal.

Concurrency: how many things are in flight at the same time. This is the input you control, and it is the axis everything else is plotted against.

Read them together or you will mislead yourself. Response time holding steady while throughput has flatlined and errors are climbing is not a healthy system. It is a system that has started refusing work, and refusing work is fast.

Those four are also what a client-side performance exercise measures, from a different angle. If your concern is how a phone application feels rather than whether a server holds up, mobile app performance optimization is the companion subject.

Why the average is the least useful of them

If you take one thing from this page, take this. The average response time is close to worthless, and it is the number most reports lead with.

Suppose ninety-five requests come back quickly and five take twenty seconds. The average looks fine. Five percent of your users are having an experience nobody would defend, and the number designed to summarise the system has concealed them.

So use percentiles instead. The ninety-fifth percentile is the value that ninety-five percent of requests come in under. The ninety-ninth is the same idea, stricter. Together they describe the tail, and the tail is where complaints, timeouts and abandoned sessions live.

The gap between the median and the ninety-fifth percentile is itself diagnostic. A small gap means the system behaves consistently. A large one means a subset of requests is doing something different: hitting a slow path, waiting on a lock, missing a cache, querying without an index. You have found a question worth asking before you have run a single extra test.

Why a system that works for one user fails for a thousand

The intuition most people carry is that a system handles load proportionally, so ten times the users means ten times the work and roughly the same behaviour. It does not work that way, and understanding why is most of what performance testing teaches.

Systems have shared resources with hard limits. A connection pool holds a fixed number of connections. A thread pool holds a fixed number of threads. Memory is finite. When demand stays under those limits, adding users adds work and little else. When demand crosses one of them, requests stop being served and start queueing.

Queueing is where the behaviour changes shape. A request that took a moment now takes that moment plus the wait, and the wait grows with the queue. Response times do not rise gently as load increases; they hold flat and then climb steeply, because the system is fine until it is not.

This is why a test at the expected load is not enough. It tells you that you are on the flat part of the curve today. It does not tell you how much room is left before the cliff, and the expected load was an estimate.

Types of performance testing, by the question each one answers

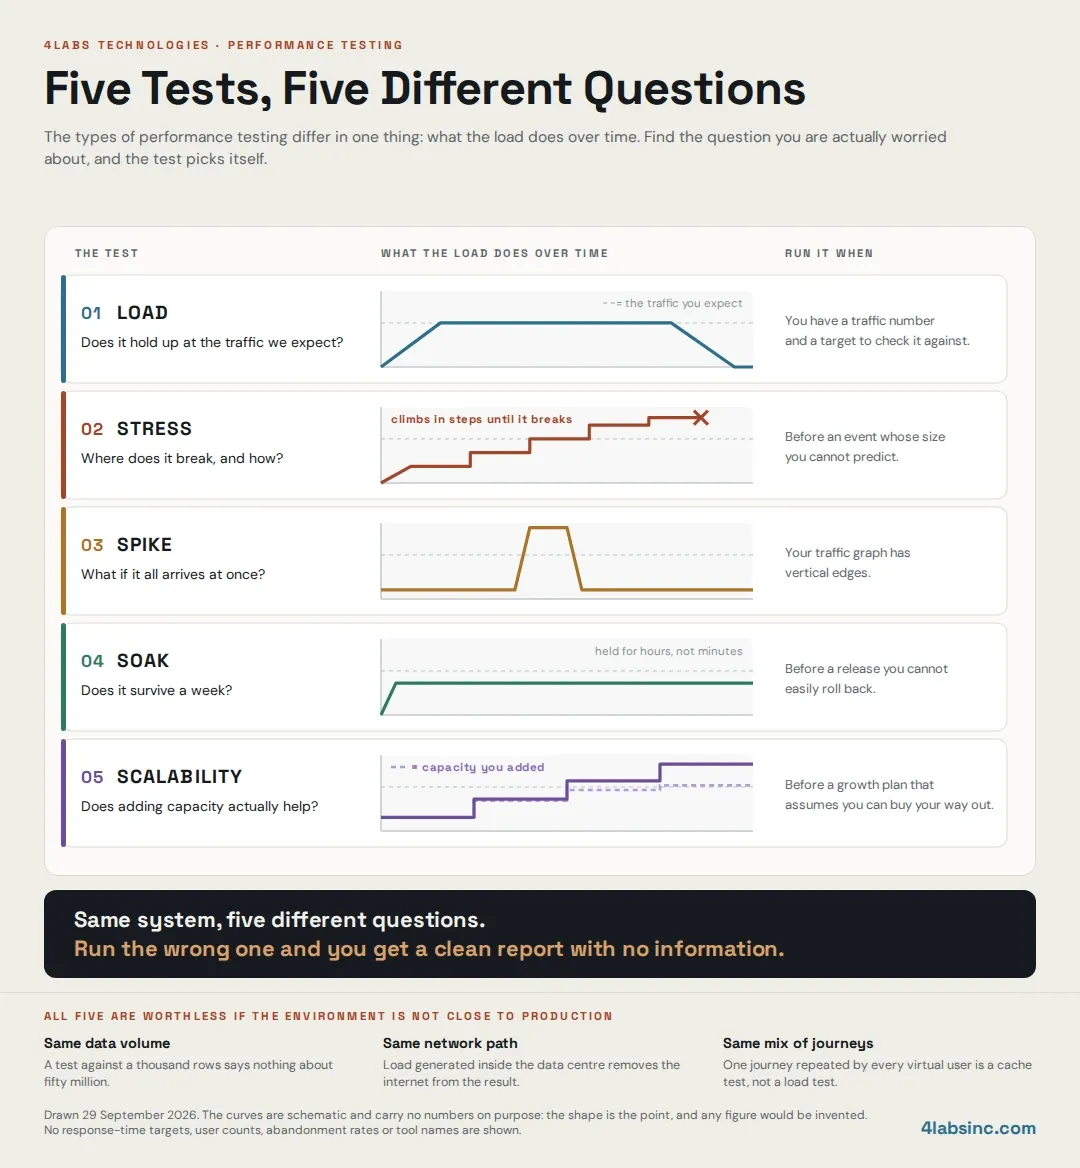
The five types differ in one thing: what the load does over time. Everything else follows from that shape. So do not start by asking which type to run. Start by asking what you are worried about, and the type falls out of the answer.
performance-testing-five-load-shapes.webp

Load testing: does it hold up at the traffic we expect?

The shape: ramp up to the expected traffic, hold it steady, ramp back down.

This is the baseline test and the one most teams mean when they say performance testing. It answers the narrowest question in the set: at the volume we plan for, does the system stay inside its targets?

Run it when you have a number for expected traffic and a target to check it against. It is also the right test to repeat, because a stable load test is the thing a regression shows up against.

What it will not tell you is anything about the margin. A pass means you are fine at that level and says nothing about the level above it, which is the next test.

Stress testing: where does it break, and how?

The shape: a staircase, climbing past the expected load, step after step, until something gives.

The point is not the number at which it breaks, although that is useful. The point is the manner of the breaking.

A system that degrades gracefully slows down, sheds load, returns clear errors and recovers when pressure drops. A system that fails badly locks up, cascades into dependent services, corrupts state, or stays broken after the load is removed. Those two systems can have identical load test results and completely different Saturday nights.

Run this before any event you cannot predict the size of, and run it at least once on anything important, because the recovery behaviour is a fact about your system that you would rather learn deliberately.

Watch the recovery, because most teams stop the test at the break. The valuable minute is the one after you remove the load, because that is where you find out whether the system comes back on its own.

Spike testing: what happens when traffic arrives all at once?

The shape: flat and low, then a sudden tall column, then flat again.

This is a different question from stress, and the difference is the rate of change. A system that copes with a gradual climb to ten thousand users can fail at two thousand arriving in five seconds, because autoscaling has not reacted, caches are cold, connection pools are empty and everything queues at once.

Run it if your traffic is event-driven. A campaign, a broadcast, a ticket release, a market open, a notification sent to every user simultaneously. If your traffic graph has vertical edges, the gradual tests are not testing your reality.

Soak testing: does it survive a week?

The shape: a modest, ordinary load, held for a very long time, hours rather than minutes.

This catches the class of problem that only appears with duration. A memory leak that adds a little each hour, a connection pool that loses one connection per thousand requests, a log file nobody rotates, a cache that grows without eviction, a queue that drains slightly slower than it fills.

None of these show up in a twenty-minute load test. All of them show up on day three in production, usually as a gradual slowdown followed by a restart that appears to fix it, which is how a leak survives for a year.

Run it before a release you cannot easily roll back, and run it long enough to be boring. The value is in the trend line, not the peak.

Scalability testing: does adding capacity actually help?

The shape: stepped increases in load, with capacity added at each step, and a second line for the capacity you added.

The question is whether the two lines track. Double the servers, double the throughput, is the hope. Reality is usually less, and the gap is what you are measuring.

It matters because the answer decides your architecture rather than your tuning. If throughput stops improving as you add capacity, something is shared and serialised: a single database, a lock, a queue, an external service with its own limit. No amount of extra application capacity moves a constraint that lives somewhere else.

Run this before committing to a growth plan that assumes you can buy your way out. The honest finding is often that you can, up to a point, and the point is closer than expected.


The performance test environment decides whether the result is worth anything

This is the section missing from almost every page on this subject, and it is the reason most first performance programmes waste a cycle.

A performance result is a statement about a specific system in a specific environment with specific data. Change any of those and the number changes, sometimes by a lot. Test against something that does not resemble production and you have measured something real, just not the thing you care about.

The symptom is familiar: the test passed comfortably, the release went out, and the system fell over at a fraction of the load the test had cleared. Nobody lied. The test was answering a different question.

Production parity, and what you can safely differ on

Full parity is rarely affordable. The useful skill is knowing which differences change the answer and which do not.

Differences that usually invalidate the result: a smaller database, because query plans change with data volume and an index that was optional becomes essential; fewer or slower instances, because you are measuring a different machine; a different database engine or version; a missing caching layer, or an empty one; running without the load balancer, the proxy or the rate limiter that sit in front of production.

Differences you can usually live with: a smaller number of application instances, provided you scale the load proportionally and are honest that you are testing per-instance behaviour. Reduced redundancy, as long as you are not testing failover. Test doubles for third-party services, provided you model their real latency rather than returning instantly, which is the mistake that makes everything look fast.

The honest compromise is a scaled environment where the ratios hold: same architecture, same software versions, same data shape, proportionally less of everything, and every result reported with the scaling factor attached. That is defensible. An unlabelled number from an unlike environment is not.

Where the environment lives and how faithfully it can be reproduced is usually a cloud infrastructure question rather than a testing one, and it is worth settling before the first test rather than after the first surprise.

Test data volume and shape

Data is the difference teams underestimate most, and it is the cheapest to get wrong.

Volume changes behaviour because databases change strategy as tables grow. A query that scans a small table quickly becomes the slowest thing in the system when the table is large. That transition does not announce itself, and it does not appear in a test against a small dataset.

Shape matters as much as size. Real data is uneven. Some customers have one order and some have forty thousand. Some search terms match nothing and some match half the catalogue. Evenly distributed synthetic data hides exactly the cases that cause trouble, because the expensive path is the unusual one.

So generate test data with realistic distribution, including the outliers, or work from a sanitised copy of production. And vary the inputs across virtual users. A thousand users all requesting the same record is a cache test with a performance test's name on it.

The thousand-row database that proves nothing

The most common version of this mistake looks like diligence.

Somebody sets up a test environment, loads a representative sample of a few thousand rows, runs the load test, and gets excellent numbers. Everything is fast, because everything fits in memory and every query is cheap at that size.

Production has fifty million rows. The working set no longer fits in memory. Queries that were served from cache now hit disk. The query planner picks different plans. Locks that were never contended are contended. None of this was visible, and none of it was a coding error.

If you take one environment rule from this page: match the data volume before you match anything else. It is usually the cheapest fidelity to buy and the most expensive to skip.

Where the load is generated from

The last piece of environment fidelity is the one nobody thinks about: the machine producing the load.

If your load generator sits on the same network as the system under test, you have removed the internet from the measurement. Real users arrive over links with latency, packet loss and bandwidth limits, and those change both the numbers and the failure modes. A test from inside the data centre can show excellent response times for a system that feels slow to everybody outside it.

The opposite mistake is just as common. A single generator machine that runs out of its own CPU, memory or network capacity will report rising response times that belong to the generator rather than to the application. Always monitor the generator as carefully as the target, and always confirm it has headroom before believing a result.

Where your users actually are matters too. If half of them are in another region, generating all the load from one place near the servers is not a test of their experience.

Where a performance target comes from

Every page on this subject tells you to set performance goals. Almost none tells you where the number comes from, so most teams pick one that sounds right and defend it for years.

A target that was invented is worse than no target, because it gets treated as a fact. Work fails a threshold nobody can justify, or passes one that was never demanding enough.

Starting from the business, not the benchmark

A defensible target starts from what the system is for.

Ask what the operation is and who is waiting. A user watching a page load has a different tolerance from a batch job running overnight, and both are different from an API a partner is calling under their own timeout.

Then look at three sources, in order of usefulness.

What you do today: measure the current system under current load. That is your baseline, and it is the only number on the page that is definitely true about you. Most targets are best expressed relative to it: no worse than today, or better by a stated amount.

What the workflow requires: some numbers come from the work itself. A device that samples every second cannot take longer than a second to process a sample. A checkout that must complete inside a payment provider's timeout has that timeout as a hard ceiling. These are facts, not preferences, and they make the strongest targets.

What your users compare you to: and not an industry benchmark, which is a number about other people's systems. The applications your own users switch between. That comparison is what shapes their expectation, and you can measure it.

Notice what is absent. No universal figure, no under three seconds, no benchmark from a report. Those numbers describe somebody else's system and somebody else's users.

Writing a threshold somebody will sign

A target that cannot be checked mechanically is an aspiration. Four things make it a threshold.

A named operation: not the application. The specific request or transaction, because different operations have different budgets and averaging across them hides both.

A percentile: the ninety-fifth percentile rather than response time, because without a percentile you have implicitly agreed to be judged on the average, and the average hides the tail.

A load condition: because a number is meaningless without the traffic it holds at. Under two thousand concurrent users is part of the target, not context.

An owner: somebody who agrees the number is right for the business and will be the one deciding what happens when it is missed.

Put together: the ninety-fifth percentile for checkout completes within the agreed budget, at the load we expect on the busiest day of the year, signed off by the product owner. That is checkable, arguable and enforceable in a pipeline.

Then write it down where the build can read it. A threshold in a document is a memory. A threshold in the pipeline is a control, and it is the only version that survives a busy quarter.

The performance testing process, end to end

With the type chosen, the environment honest and the target written, the process itself is short. Most of the difficulty was in the three decisions above it.

Building a workload model that resembles reality

A workload model describes what your virtual users do. It is where synthetic tests most often drift away from the system they are meant to represent.

The common failure is a single-journey test. A thousand virtual users all doing the same thing, usually the thing that was easiest to script. Real traffic is a mixture: some browsing, some searching, some checking out, a few administrators doing something expensive, and a background of automated traffic nobody thinks about.

Build the mixture from your own logs rather than from intuition. Take the real distribution of operations over a busy period, weight the model to match it, and you have a test that resembles a day rather than a demonstration.

Three details make the difference between a plausible model and a misleading one.

Think time: real users pause. A script without pauses generates a request rate no human population produces, which sounds conservative and is actually a different test.

Data variation: every virtual user should work with different records. Identical inputs turn a performance test into a cache test.

Background load: scheduled jobs, reports, integrations and backups run whether or not you are testing. If production has them, the model should.

This is the same discipline as writing a software testing plan: the value is in deciding what to represent, and the scripting is the easy half.

Ramp-up, steady state and what to ignore

A test run has three phases and only one of them produces the number.

Ramp-up: load climbs from nothing to the target level. Response times here are unstable and usually bad, because caches are cold, connection pools are filling and everything is starting up. This is not the result.

Steady state: load holds at the target. This is the measurement window, and it should be long enough for the system to settle and then to stay settled. Short steady states flatter systems that are slowly getting worse.

Ramp-down: load falls away, which is useful for watching recovery rather than for measuring performance.

So report the steady state and exclude the rest, and say so in the report. A number quoted across the whole run is a blend of a system starting up and a system working, and it is not a description of either.

One more rule: discard the first run against a fresh environment. Caches are empty, code is not warmed, and the numbers are pessimistic in a way that has nothing to do with how the system behaves in life.

Performance testing tools, by category rather than by name

Naming products dates a page immediately and reads as an endorsement, so here are the categories instead. Our roundup of testing tools goes further into the landscape.

Protocol-level load generators send requests directly, without a browser. They are efficient, so one machine can simulate a large population, and they measure server behaviour rather than user experience. This is the right category for almost all backend load testing.

Browser-based tools drive real browsers and measure what a user would see, including rendering. They are far heavier per virtual user, so they suit smaller, more realistic scenarios rather than volume.

Application performance monitoring watches the system from inside while the test runs, which is what turns a slow number into a named cause. Without it you know the system is slow; with it you know which call is slow.

Profilers go deeper still, into individual methods and queries. Reach for one after monitoring has told you which component to look at, not before.

Most programmes want a protocol-level generator plus monitoring, and add the rest as questions arise. Choose on whether the tool can express your workload model and produce percentiles you can trust, not on the feature list.

Reading a failure: from a slow number to a named cause

A failed test gives you a number and a graph. Turning that into a cause is the part the result set stops before, and it is the part worth learning.

Start by reading the shape rather than the value. Response times that climb steadily with load mean something is saturating gradually. Times that hold flat and then jump mean a limit was crossed. Times that are fine until a specific minute mean something happened then: a job started, a cache expired, a token was refreshed.

The four places time usually goes

Almost every performance problem resolves into one of four.

Waiting for CPU: the processor is saturated. Throughput flattens, response times climb, and everything slows together. Usually inefficient code, sometimes serialisation nobody intended, occasionally genuinely insufficient hardware.

Waiting for memory: memory pressure shows as pauses rather than a steady slowdown, because collection or swapping stops work briefly and repeatedly. Erratic response times with a healthy average are the signature.

Waiting for input and output: on disk or network, and usually a database: an unindexed query, a lock held too long, a table that has outgrown its plan. This is the most common category by a distance.

Waiting for a turn: queueing behind a limited resource such as a connection pool, a thread pool, a rate limiter or a single-threaded service. The tell is that the resource itself looks idle while requests wait, because the constraint is the number of slots rather than the work.

That last one catches people out, because every dashboard looks healthy: low CPU, low memory, fast queries, slow responses. When everything looks idle and the system is slow, you are queueing, and the next question is what for.

Why the first bottleneck is never the last

Fix the slowest thing and something else becomes the slowest thing. This is not a failure of the fix; it is what the system was always going to do.

A system has a sequence of constraints. Remove the first and load moves through to meet the second, which may be much closer than anyone expected. So plan performance work as several rounds rather than one, and re-test after every change, because the second bottleneck is usually somewhere nobody was looking.

The corollary is when to stop. Stop when the target is met with headroom, not when the system cannot be made faster, because it can always be made faster and the returns shrink each round. Diminishing returns arrive quickly in this work, and the point at which optimisation stops paying is usually earlier than an engineer's instinct suggests.

Performance testing best practices: when to run which test

The traditional answer is a performance phase before release. It is the worst available option, because it is the point at which nothing can be changed. A finding a week before launch becomes a risk to accept rather than a problem to fix.

The better model is three sizes of test, running at three different rhythms.

A small check on every build: a handful of virtual users against the critical operations, taking a couple of minutes, failing the build if the response time moves beyond an agreed margin. It will not find a capacity limit. It will find the change that made a key query ten times slower, on the day somebody made it, while they still remember why. That is the highest-value performance work most teams are not doing.

A full load test on a schedule: weekly or per release candidate, with the real workload model, the honest environment and the agreed thresholds. This is the test that answers whether you meet your targets, and it needs to be routine enough that a failure is information rather than an event. The decision about what to automate here follows the same reasoning as automated and manual testing anywhere else.

A deep test before structural change: stress, spike, soak or scalability, chosen by what the change threatens, whether that is a new database, a migration, a major architectural shift or an expected surge in traffic. These are expensive, so run them when there is a specific question worth the cost.

Three more practices that pay for themselves.

Keep the history, because performance results are only interesting in comparison. A number from today means little; the same number tracked across thirty releases shows you the drift you would otherwise never see.

Test in production too, carefully: synthetic checks against the live system, at low volume, tell you what real users are actually getting. The test environment tells you what should happen; production tells you what does.

Treat a performance failure as a defect, because if it goes into the same queue as functional bugs, with an owner and a priority, it gets fixed. If it goes into a separate performance report, it gets read and filed.

One closing note on scope. Performance and security both fail under adversarial conditions, and both are easiest to design for early. The same argument for shifting performance testing left applies to security testing, and teams usually move both or neither.

Performance testing: quick answers

What is performance testing in software development?

Performance testing measures how a system behaves under load rather than whether it produces the right answer. It produces four numbers: response time, throughput, error rate and concurrency. Its purpose is to find where the system's limit is, and how it behaves when it reaches it, before real traffic finds out first.

What is the difference between load testing and stress testing?

Load testing holds the traffic you expect and asks whether the system stays inside its targets. Stress testing pushes past that level until something breaks, and the useful finding is how it breaks: whether it degrades gracefully and recovers, or locks up and stays broken. Load testing tells you that today is fine. Stress testing tells you how much room you have.

When should performance testing be done?

Continuously, in three sizes. A small check on every build, taking a couple of minutes against the critical operations, to catch the change that made something ten times slower. A full load test weekly or per release candidate. And a deep test — stress, spike, soak or scalability — before a structural change. A single performance phase before release is the traditional model and the least useful, because nothing can be changed by then.

How many users should a performance test simulate?

There is no portable number. Start from your own traffic data at the busiest period you have measured, then test at that level, at a multiple of it to find your headroom, and at the level you expect after whatever growth you are planning for. A count borrowed from another organisation describes their system, not yours.

What makes a performance test result unreliable?

Most often the environment. A smaller database changes query plans, a missing cache layer changes everything, and generating load from the same network as the system removes the internet from the measurement. Other common causes are a single-journey workload model, no think time, identical data across virtual users, measuring across ramp-up instead of steady state, and a load generator that ran out of its own capacity.

Where to take your performance testing next

The most common outcome of a first performance test is not a failure. It is a number nobody can interpret, produced in an environment nobody trusts, against a target nobody agreed. That is a scoping problem rather than a testing problem, and it costs a cycle to discover.

So before the next test, settle three things. Which question you are asking, which decides the type. Whether the environment is close enough to production to make the answer mean something. And where the target came from, so a failure is a decision rather than an argument.

If you are setting that up, or holding a result you are not sure you believe, talk to 4Labs Technologies. Bring the number and the environment it came from. Half the useful conversation is about whether the test was measuring what you think it was.

‹ PreviousNext ›